
Growth creates a data problem before it creates a revenue problem.
At $3 million to $50 million in annual revenue, your business may have plenty of information: but not enough visibility. Financial data lives in one system, customer information in another, inventory updates arrive by email, and operational decisions still depend on spreadsheets, memory, and recurring meetings.
The result is predictable: leaders spend too much time debating whose numbers are correct and not enough time acting on what the numbers mean.
Real-time business insights change that. When operational data is connected, defined, and presented through useful performance dashboards for business, your team can move from reactive problem-solving to confident decision-making. That is the foundation of operational excellence: and a central focus of Brown Paper Analytics’ Measurement & Clarity and Process & Efficiency pillars.
Real-time insights are more than fast reporting
Real-time business insights do not simply mean producing reports more quickly. They mean creating a reliable connection between:
- What is happening in the business
- Why it is happening
- Who needs to respond
- What action should happen next
A dashboard that updates every few minutes is not useful if the underlying data is inconsistent. Likewise, a perfect report does not create value if no one knows which decision it should inform.
The goal is not more data. The goal is less uncertainty.
For example, a leadership team should be able to answer questions such as:
- Are sales converting into profitable work?
- Which projects or jobs are consuming more labor than planned?
- Where are approvals slowing delivery?
- Is inventory supporting demand or tying up cash?
- Can the business meet its next payroll and supplier obligations?
- Which customer commitments are at risk?
When those answers require several spreadsheets and multiple conversations, your operating model is already carrying unnecessary friction.
Why performance dashboards for business matter
Performance dashboards for business give leaders a shared view of the metrics that matter most. Instead of waiting for a month-end package or asking several departments to reconcile their numbers, decision-makers can see current performance, trends, exceptions, and ownership in one place.
A strong dashboard should do three things well:
-
Show the current state
What is happening right now across revenue, cash, operations, customers, projects, or inventory? -
Reveal the trend
Is performance improving, declining, or staying flat? -
Point toward action
What threshold has been missed, what bottleneck needs attention, and who owns the next step?
This is why dashboard design matters. A screen filled with dozens of metrics may look sophisticated, but it can create the same confusion as a disorganized spreadsheet. Your executive dashboard should focus on a small number of decision-linked KPIs.
Examples may include:
- Gross margin by customer, project, or service line
- Cash position and short-term cash forecast
- Order backlog and on-time delivery
- Inventory availability and slow-moving stock
- Sales pipeline by stage and expected close date
- Utilization, labor capacity, or billable hours
- Cycle time and rework rate
- Accounts receivable aging and collection velocity
Each metric should have a definition, an owner, a target, and a response plan.

Measurement & Clarity: creating one version of the truth
Brown Paper Analytics approaches measurement as an operating discipline, not a reporting exercise.
The Measurement & Clarity pillar helps leadership teams define the numbers that matter, resolve conflicting definitions, and build a shared performance view. That work is essential because many reporting problems are not technology problems. They are definition problems.
One department may define “revenue” as booked sales. Another may use invoiced revenue. Finance may report recognized revenue. All three numbers may be valid in context: but they cannot support a productive leadership conversation unless everyone agrees on when and why each number is used.
Clarity requires:
- Standard definitions for critical KPIs
- Consistent reporting periods
- Clear data ownership
- Reconciled financial and operational information
- Role-based views for executives, managers, and frontline teams
- Decision thresholds that trigger action
Once those standards are in place, meetings change. Leaders spend less time defending reports and more time discussing priorities, constraints, and tradeoffs.
That is the real value of real-time insight: it shortens the distance between data, discussion, and action.
Process & Efficiency: turning insight into operational excellence
Visibility alone does not improve performance. Your team must be able to use what it sees.
This is where Process & Efficiency becomes the next step. Operational excellence depends on repeatable workflows, clean handoffs, measurable standards, and continuous improvement.
Consider a common approval problem. A customer order, project change, or purchasing request may move through email, a spreadsheet, and several informal conversations. No one has a reliable view of where the request is waiting. Delays appear as customer complaints, missed deadlines, or rushed work at the end of the process.
A connected workflow can show:
- When the request was submitted
- Whether required information is complete
- Who owns the approval
- How long the request has been waiting
- What downstream work depends on the decision
- Whether the transaction has been recorded for financial and audit purposes
That combination of workflow visibility and performance measurement helps leaders address the cause: not just the symptom.
The same principle applies to inventory. If sales, purchasing, warehouse, and finance use different data, the business may over-order one item while promising customers stock that is not actually available. A real-time operational view can connect demand, inventory levels, open orders, lead times, and purchasing activity. That supports better replenishment decisions, fewer stockouts, less excess inventory, and stronger working capital control.

Three practical ways to use real-time business insights
1. Improve forecasting and cash flow decisions
A forecast is only as useful as the information feeding it. If it is updated manually once a month, it may already be outdated when leadership reviews it.
Connecting sales pipeline, accounts receivable, customer commitments, payroll, purchasing, and operating expenses creates a more current view of expected cash movement. Leaders can then make better decisions about hiring, inventory purchases, capital investments, and payment timing.
The objective is not to predict the future perfectly. It is to identify changes early enough to respond.
2. Protect job and project profitability
For project-based businesses, revenue can look strong while profitability quietly deteriorates. Labor overruns, scope changes, unbilled work, and material costs may not become visible until the project is nearly complete.
A performance dashboard can compare estimated versus actual hours, costs, billings, and progress. That gives project leaders an opportunity to correct scope, staffing, pricing, or delivery assumptions before the margin is gone.
3. Strengthen the CRM-to-operations handoff
A signed deal is not the same as a deliverable deal.
When sales closes a contract without transferring complete requirements, pricing assumptions, timelines, or customer commitments to operations, delivery teams inherit ambiguity. The customer experiences delays, while internal teams spend time reconstructing what was promised.
A connected process can make the handoff auditable and repeatable. Required fields, approval steps, capacity checks, and project setup can become part of the workflow rather than depending on individual memory.
Why this matters at the $3M–$50M stage
Smaller businesses often succeed through personal involvement. The founder knows the customers, the team, the suppliers, and the exceptions. That can work at an early stage.
As the business grows, the same model becomes a constraint.
More customers create more transactions. More employees create more handoffs. More locations, services, products, or projects create more operational variables. The founder cannot remain the central source of truth for every decision.
This is the point where ERP and connected performance dashboards become essential infrastructure: not optional software.
An ERP operating model helps connect finance, inventory, projects, procurement, CRM, and operations. But technology alone is not the answer. The system must reflect how your business should work, with clear ownership and processes that people can actually follow.
Brown Paper Analytics treats this as a long-term operating model through the BPA IMPACT SYSTEM. The emphasis is on building from the inside out: clarify the measures, improve the process, align the people, and create the operating rhythm required for sustainable growth.
Common objections: and a practical response
“It is too expensive.”
The cost of disconnected operations is often hidden in rework, delayed billing, excess inventory, slow month-end close, missed opportunities, and management time spent reconciling reports.
A practical business case should focus on measurable value: hours saved, errors reduced, close time shortened, cash improved, and throughput increased.
“It will disrupt the business.”
A large, all-at-once rollout can create disruption. That is why a phased approach is usually more effective.
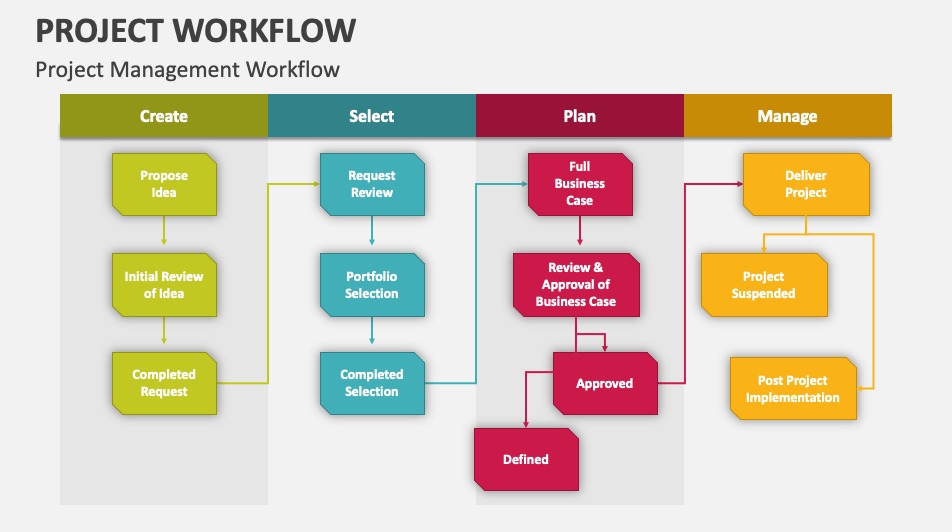
Start with the workflows and decisions that create the most cost or risk. Map the current state, define the future state, pilot the change, train the people involved, and expand once the process is stable.
“We will do it later.”
Later usually means after another spreadsheet, another hire, another customer escalation, or another margin surprise.
You do not need to transform everything at once. But you do need to understand where visibility and process gaps are limiting the next stage of growth.
A practical roadmap to better decision-making
Your next step does not have to be a software purchase. It should be an assessment.
A useful roadmap includes:
-
Current-state assessment
Identify where data lives, how decisions are made, and where reporting or workflow friction exists. -
KPI and decision design
Define the metrics leadership needs, how they are calculated, and what actions each metric should support. -
Process mapping
Document critical workflows such as quote-to-cash, procure-to-pay, order fulfillment, project delivery, or month-end close. -
Prioritized implementation plan
Select the highest-value improvements and sequence them into manageable phases. -
Adoption and operating cadence
Build dashboards into daily huddles, weekly operating reviews, and monthly leadership decisions. -
Ongoing optimization
Review results, refine the metrics, and improve the system as the business changes.
Real-time business insights are most valuable when they become part of how the company runs: not just another screen people occasionally open.
Turn operational data into confident decisions
If your leadership team is spending too much time chasing numbers, correcting handoffs, or reacting to problems after the financial impact is already visible, it may be time to strengthen your operating foundation.
Brown Paper Analytics can help you assess your current reporting and workflows, identify the highest-value opportunities, and create a practical process-to-system roadmap.
Request an ERP readiness assessment or book a discovery call to clarify what your business needs next.