You've got dashboards. Maybe a lot of them. Spreadsheets with pivot tables, a BI tool someone set up two years ago, reports that get emailed every Monday morning. But here's the question that matters: when was the last time anyone actually did something because of what they saw on a dashboard?
For most growing businesses in the $3M–$10M range, the honest answer is "rarely." And that's not because leadership doesn't care about data. It's because the dashboards they're looking at aren't connected to the systems where work actually happens.
That's the difference between a dashboard that looks impressive and one that drives action. And it's exactly why building your KPI dashboards inside your ERP changes everything.
The Dashboard Problem Nobody Talks About
Most dashboards are retrospective. They tell you what happened last month, last quarter, maybe last week if you're lucky. By the time you're looking at the numbers, the moment to act has already passed.
Worse, they're usually disconnected from the source. Someone pulls data from your accounting software, massages it in a spreadsheet, builds a chart, and emails it around. By Wednesday's leadership meeting, you're making decisions based on information that's already stale: and you can't drill into the details without asking someone to go dig through transactions.
This is fine when you're running a $1M operation with a handful of people. But once you're pushing toward $5M, $7M, $10M? That lag time kills you. Margins slip. Cash flow surprises hit. Problems that could've been caught early turn into fires that consume your week.
The issue isn't that you don't have enough data. It's that your data isn't connected to your operations in a way that enables real-time decision-making.
What Makes an ERP Dashboard Different
When your KPI dashboard lives inside your ERP, it's not a separate reporting layer. It's a window directly into your operations: updated in real time, connected to every transaction, and designed to show you exactly what needs attention.
Here's what that looks like in practice:
Real-time visibility. Your dashboard doesn't wait for someone to refresh a spreadsheet. When an invoice gets posted, when inventory moves, when a project milestone gets marked complete: your KPIs update automatically. You're not looking at last week's reality; you're looking at right now.
Drill-through capability. See a margin that looks off? Click through to the job. Click through to the line items. Click through to the purchase orders and time entries that drove the cost. No more "let me get back to you on that." The answer is right there.
Single source of truth. Everyone: finance, operations, sales, leadership: is looking at the same numbers. No more conflicting reports. No more debates about whose spreadsheet is right. One system, one set of data, one version of reality.
This is what Measurement & Clarity actually looks like when it's built into your systems instead of bolted on top.

The Metrics That Actually Matter (And Who Should See Them)
Here's where most dashboard projects go wrong: they try to show everyone everything.
The result? Information overload. Decision paralysis. Dashboards that nobody looks at because they're overwhelming and nothing feels actionable.
An effective ERP dashboard is role-specific. Your CFO doesn't need to see the same metrics as your project managers. Your sales team doesn't need the same view as your operations lead. Each person should see the KPIs that are relevant to their decisions: and nothing else.
For the CEO/COO:
- Revenue vs. forecast (with trend lines)
- Gross margin by service line or product category
- Cash position and 13-week cash flow projection
- Capacity utilization across teams
For the CFO:
- AR aging and collections velocity
- AP aging and payment timing
- Month-to-date close progress
- Budget variance by department
For Operations Leaders:
- Job profitability (actual vs. estimated)
- Resource allocation and utilization
- On-time delivery rates
- Backlog and pipeline visibility
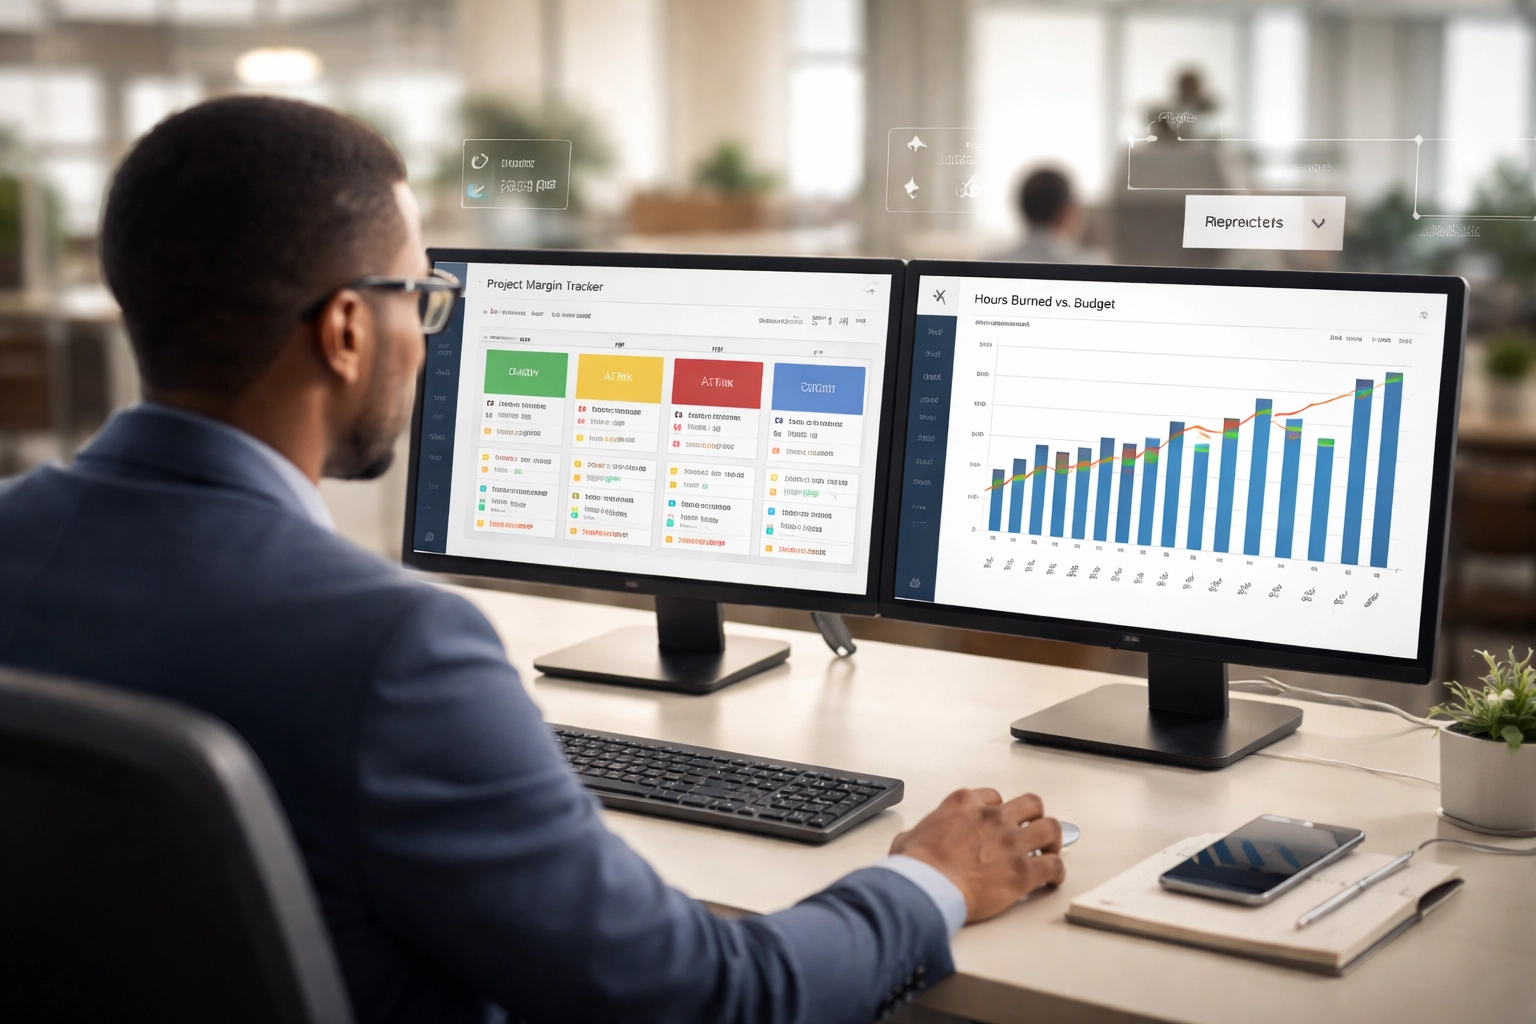
For Project/Account Managers:
- Project margin tracking (live)
- Hours burned vs. budget
- Milestone completion status
- Open change orders or scope risks
When everyone has a dashboard tailored to their role, two things happen: they actually use it, and they can act on what they see without wading through irrelevant data.
A Real Example: Catching Margin Erosion Before It's Too Late
Let's make this concrete. Say you're running a professional services firm doing $6M in revenue. You've got 15 active projects at any given time, and your target gross margin is 45%.
In a spreadsheet-driven world, here's what happens: your project managers track hours in one system, expenses get entered into accounting separately, and someone reconciles everything at month-end. By the time you realize Project X is running at 28% margin instead of 45%, you're three weeks into the problem. The extra hours have already been worked. The budget is already blown.
In an ERP with a properly configured dashboard? Your project managers see margin tracking in real time. The moment labor costs start trending above estimate, a KPI tile goes yellow. They can drill into the hours, see which tasks are over budget, and course-correct before the damage compounds.
That's the difference between managing by exception and managing by surprise. One is proactive. The other is expensive.
Why This Matters at $3M–$10M
At this stage, you're past the point where the founder can hold everything in their head. You've got more people, more projects, more complexity. But you probably haven't built the systems infrastructure to support that complexity yet.
This is the "visibility gap" that trips up so many growing companies. You're too big for gut-feel management, but you haven't invested in the financial performance and analytics infrastructure that lets you manage with precision.
An ERP dashboard closes that gap. It gives you the operational control you need to:
- Protect margins by catching cost overruns early
- Improve cash flow by monitoring AR/AP in real time
- Make faster decisions because the data is always current
- Hold teams accountable with shared visibility into KPIs
- Scale without chaos because your systems grow with you
This isn't about fancy technology. It's about building the operational foundation that lets you grow from $5M to $10M without everything feeling harder than it should.
Design Principles for Dashboards That Get Used
If you're planning to build KPI dashboards inside your ERP, keep these principles in mind:
Keep it simple. Resist the urge to cram every metric onto one screen. Five to seven KPIs per dashboard is plenty. If it's important, it gets a spot. If it's not, it doesn't.
Make it visual. Charts and graphs beat tables of numbers. Trend lines beat point-in-time snapshots. Color coding (green/yellow/red) makes it instantly clear what needs attention.
Enable drill-through. A KPI that you can't investigate is just a number. Every metric should let users click through to the underlying data.
Design for mobile. Leadership shouldn't need to be at their desk to check the pulse of the business. Make sure your dashboards work on a phone or tablet.
Review and refine. Your first dashboard won't be perfect. Plan to iterate based on what people actually use and what questions keep coming up.

The Path Forward: From Spreadsheet Reports to Operational Control
Building actionable dashboards inside your ERP isn't a weekend project. It requires clarity on what you're trying to measure, clean data to measure it with, and thoughtful configuration to present it in a way that drives action.
That's where most businesses get stuck. They know they need better visibility, but they don't have a roadmap for getting there.
At Brown Paper Analytics, we help growth-minded businesses design and implement KPI dashboards that actually get used. We start with your operational priorities, map the metrics that matter to each role, and configure your ERP to deliver real-time visibility across the organization.
No generic templates. No dashboards that look good but don't connect to your reality. Just practical, actionable reporting infrastructure built for how your business actually runs.
Ready to Build a Dashboard That Drives Action?
If you're tired of stale reports and spreadsheet chaos, it's time to build the measurement infrastructure your growth demands.
Contact Brown Paper Analytics to schedule a discovery call. We'll assess your current reporting gaps, identify the KPIs that matter most for your stage, and map out a custom dashboard roadmap designed to give you the visibility and control you need to scale.
Stop guessing. Start seeing. Let's build a dashboard that actually works.